 A report, co-authored by Margaret Cahalan, also found a drastic decline in the purchasing power of the Pell Grant for low-income students.
The percentage of students from low-income families who go on to earn a bachelor’s degrees is almost the same today as it was in 1965 — 6 percent
then versus 9 percent now — while the percentage of students from
high-income families who go on to earn a bachelor’s degree has skyrocketed between then and now — 40 percent then versus 77 percent now.
That is one of the most disquieting findings of “Indicators of Higher Education Equity in the United States,” a report released jointly Tuesday by the Pell Institute for the Study of Opportunity in Higher Education and PennAHEAD,
or Alliance for Higher Education and Democracy.
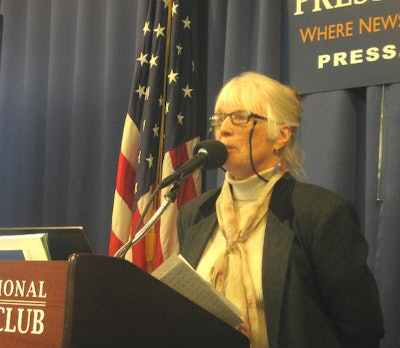
“It’s pretty discouraging,” said Laura Perna, co-author of the report and education professor at the Penn Graduate School of Education, where she is executive director of PennAHEAD, or Alliance for Higher Education and Democracy.
“I think there is some progress, but the magnitude of the gaps that persist are
so large,” Perna said of the report’s findings during an interview Tuesday
at the National Press Club.
Asked if the widening of the gap between rich and poor students who earn a bachelor’s degree suggests that higher education policies and initiatives such as the Higher Education Act of 1965 and Pell Grants have failed, Perna said the gap shows that there is a perpetual need to examine higher education policy and practice in light of ongoing shifts in the demographics of the United States.
“I think the inferences are we need to continually be revising the policies and practices we have in place,” Perna said. “To conclude from this that the policies haven’t had any effect ignores other types of societal changes, changes in demographics and expansions of other types of opportunities.
“There’s more choice now in our system,” Perna continued.
The report also found a drastic decline in the purchasing power of the Pell Grant for low-income students and large disparities in the percentage of poor students who go to two-year and for-profit colleges versus public and private non-profit four-year universities, where the completion rates are higher.
“Choice adds the promise of benefit but it also creates challenges,” Perna said.
Perna said the report suggests two main priorities — making sure college is affordable and academic readiness.
The affordability issue should be tackled through boosting the purchasing power of Pell Grants controlling tuition and increasing state appropriations for higher education.
“College affordability is one key,” Perna said. “The second is around academic readiness. We have to make sure all students are not only academically ready to enter but to persist to degree completion.
“A third type of policy is that it’s important to make sure those that start out at two-year institutions are able transfer without loss of credits,” Perna said.
The “Indicators” report contains charts and tables on six “equity indicators” that deal with issues of higher education access and affordability between different income groups in the United States.
In short, the indicators show:
• A modest narrowing of the gap between students from the bottom and top family income quartiles who go on to college. In 1970, the gap was 46 percentage points with 28 percent from the bottom quartile going to college versus 74 percent from the top quartile. In 2012, the gap was 37 percentage points, with 45 percent from the bottom quartile going to college versus 82 percent from the top quartile.
• A widening of the gap between Pell and non-Pell students who enroll at four-year versus two-year institutions. In 2001, the gap was 14 percentage points but grew to 20 percentage points in 2012. Specifically, in 2001, 71 percent of non-Pell students went to four-year institutions versus 57 percent of Pell students. In 2012, 75 percent of non-Pell students went to four-year institutions versus 55 percent of Pell students.
• A decline in the maximum Pell Grant in “constant 2012 dollars” from 1974 through 2012 while college costs rose. Specifically, in 1974, a Pell Grant was worth $4,690 in 2012 dollars versus $5,550 in 2012. But college costs rose from an average $8,858 in 2012 dollars in 1974 to $20,234 in 2012.
• Students and families are paying for a greater share of the cost of higher education — 33 percent in 1977 versus 49 percent in 2012.
• In 2013, students from high-income families were eight times more likely to obtain a bachelor’s degree by age 24 than those from low-income families — 77 versus 9 percent. The advantage is larger than it was in 1970, when those from high-income families were just five times more likely to obtain a bachelor’s degree than students from low-income families.
The report — coauthored with Margaret Cahalan, vice president for research at the Council for Opportunity in Education and director of the Pell Institute for the Study of Opportunity in Higher Education — contains a series of recommendations to reduce disparities by income in higher education.
They range from increasing the reach, funding and capacity of college access programs to restoring Pell Grants to their former buying power.


