As the number of White students receiving college degrees has
stayed steady for the last five years, the number of African American,
Hispanic. Asian. and Native American degree recipients has soared.
“It’s real progress,” says Dr. Michael Nettles, director of the
Frederick D. Patterson Institute, the research and of The College
Fund/UNCF. “It’s phenomenal.”
According to an analysis by Black Issues In Higher Education of the
latest Department of Education data (see chart, page 23), the number of
African Americans receiving associate degrees is increasing at a rate
of 5.8 percent a year, while the number receiving bachelor’s degrees is
increasing at a rate of 5.6 percent a year, yielding a five-year growth
rate of roughly 24 percent.
“It’s good news. It’s a good story,” says Deborah Carter, director
of the American Council on Education’s (ACE) Office of Minority Al
fairs. “We are seeing the benefits of the outreach and diversity
efforts that colleges and universities have been making.”
The increasing success of Blacks in higher education offers an
optimistic contrast to other social trends — such as the rising
incarceration rate of African Americans over the last five years —
that have caused enormous concern among policy makers nationwide.
Unlike the incarceration data, however, the increase in degree
attainment has hardly been noticed:
“All we know is that on the higher education front, more African
Americans are making the right choice — and that is to pursue as much
education as is available,” Nettles says. “People are understanding the
opportunities and the relationship of higher education to upward
mobility.”
The Fruits of the Labor
This year’s Top 100 data reveal that African Americans aren’t the
only people of color achieving noteworthy progress in higher education.
The number of Latinos receiving degrees increased 7.8 percent a
year for associate degrees and 8.6 percent for baccalaureates.
Even Native Americans, who have traditionally have had very low
rates of participation in higher education, have increased the number
of associate and baccalaureate degrees earned — by 7.3 and 7.2 percent
respectively.
Asian Americans have increased the number of degrees earned by
somewhat higher percentages than other students of color. Associate
degrees earned increased by a rate of 9.8 percent per year, and
baccalaureate degrees increased by 7.4 percent. The increase in college
going among Asian Americans has been widely documented, whereas that of
other students of color has been widely overlooked.
By contrast, the number of Whites receiving associate degrees has
increased by only 0.7 percent annually, and the number receiving
baccalaureate degrees has actually declined by about 1.2 percent a year.
Demographers who were consulted for this article attribute the
stagnation of White degree attainment to the “baby bust,” in which the
actual number of White people of traditional college age declined,
after the bulge of the “baby boom.” They expect those numbers to
increase again when the children of baby boomers — affectionately
dubbed the “baby boom echo” — reach college age in about five years.
But the larger numbers of African Americans, Hispanics, Asians, and
Native Americans are seen as a function of larger percentages of
students of color going into higher education and completing their
degrees.
“This follows the trends we’ve been seeing for a couple of years,”
ACE’s Carter says. “We saw enrollment gains in the 1980s and 1990s.
What we’re seeing now are the fruits of that labor.”
Nettles agrees: “The increase in Black participation [in higher
education] is not happening automatically. There are people out there
championing this movement.”
Among initiatives cited by Nettles as examples of outreach were The
College Fund/UNCF’s program that encourages students to go into the
disciplines of math and science, Upward Bound and other TRIO programs
that encourage high school students to go to college, and the Mellon
Minority Fellows Program, which has put $22 million into helping
African American and Latino students to pursue advanced degrees in the
sciences.
The `Euphobia’ Surrounding Success
Kati Haycock, the head of Education Trust, a Washington, D.C.-based
think-tank that has highlighted the education gap between African
Americans and Whites a gap it attributes to a variety of factors
including low expectations, curriculum tracking, poorly trained
teachers, and unequal resources — gave a cautious reading of the new
numbers.
“The news on its face seems to be good news. But let’s be careful,”
says Haycock, who points out that the gap between African Americans and
Whites who hold college degrees still exists, though it is closing.
According to the latest analysis by the Patterson Research
Institute, the percent of African American eighteen-to
twenty-four-year-olds who were enrolled in higher education increased
from 25 percent in 1985 to 36 percent in 1996, while Whites increased
their percentages from 34 percent to 45 percent. Those are the kinds of
figures — the ones showing a continuing gap in college enrollment —
that keep Haycock from celebrating.
“People get complacent if they think things are improving,” she says.
Haycock’s caution mirrors that of ACE’s Carter, who is concerned
that affirmative action critics will conclude that the progress of
students of color has been at the expense of White students.
This fear persists even though most students — of any color — are
graduating from large, public institutions that are not highly
selective and where affirmative action is not used because the schools
accept most applicants.
Nettles refers to the caution displayed by both Haycock and Carter as “fear of good news,” which he termed “euphobia.”
“We’re so accustomed to associating bad news with this issue that
when we see good news, we get fearful and don’t know what to do with
it,” Nettles says. “We have gotten people to rally around bad news to
help. What we should do is use the good news to propel us to do more.”
In short, Nettles says, “It’s good news, but it can be better.”
The Numbers Also Show…
Some other observations that emerge from the Top 100 survey (see pages 40-65 for charts):
* The number one granter of baccalaureates to African Americans
was, for the second year in a row, Florida A&M University. However,
FAMU posted a slight decrease in the number of baccalaureates granted
(.03 percent) from 1995 to 1997. Although the decrease is almost
negligible, it stands in contrast to the university’s dramatic rise in
each of the previous five years. Last year was the first in which
Howard University was not ranked number one since Black Issues began
publishing its Top 100 rankings in 1991.
* By and large, the four-year schools that graduate the most
African American students in a given year are still the historically
Black colleges and universities (HBCUs) and the large public urban
colleges. This year, for the first time, Chicago State University is
the top non-HBCU conferring the most baccalaureates on African
Americans. Last year the leading non-HBCU was City College of the City
University of New York, which among non-HBCUs fell into the number two
spot and ranked thirteenth overall this year.
* Several HBCUs posted losses in the numbers of baccalaureates
conferred annually from 1995 to 1997, including Grambling State
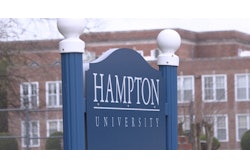
University (-4.6 percent), Hampton University (-2.6 percent), Tuskegee
University (-6.1 percent), Xavier University (-5.1 percent), and the
University of the District of Columbia (-1.5 percent).
* Other HBCUs posted dramatic annual increases over the same period
of time, including North Carolina Central University (+12.2 percent),
Texas Southern University (+13 percent), and Clark Atlanta University
(+11.3 percent).
* For Latinos, the schools that confer the most degrees are still
in California, Texas, and New York. However. New Jersey schools are
showing a strong upward trend from the private Kean College, which
increased the number of baccalaureate degrees conferred on Latinos by
20.9 percent from 1995 to 1997: to Jersey City State College, which
increased by 14.2 percent over the same time; to Rutgers University-New
Brunswick, which increased by 4.5 percent.
[GRAPHS OMITTED]
Five-Year Trends in Total Undergraduate Degrees, by Race/Ethnicity and Degree Level
1991-92 1992-93 1993-94
Non-Resident Alien
Associate 8,038 9,058 10,165
Bachelor's 28,528 32,419 34,256
Undergraduate Total 36,566 41,477 44,421
African American
Associate 38,849 41,301 45,581
Bachelor's 71,269 76,671 82,202
Undergraduate Total 110,118 117,972 127,783
Native American
Associate 3,883 4,226 4,887
Bachelor's 5,129 5,578 6,064
Undergraduate Total 9,012 9,804 10,951
Asian American
Associate 15,177 16,072 18,284
Bachelor's 46,466 50,461 54,503
Undergraduate Total 61,643 66,533 72,787
Hispanic
Associate 26,197 29,164 31,833
Bachelor's 40,260 44,591 49,243
Undergraduate Total 66,457 73,755 81,076
White
Associate 389,039 394,089 420,517
Bachelor's 921,890 932,607 918,488
Undergraduate Total 1,310,929 1,326,696 1,339,005
Unknown
Associate 24,824 23,199 12,030
Bachelor's 24,418 24,819 25,474
Undergraduate Total 49,242 48,018 37,504
All
Associate 506,007 517,109 543,297
Bachelor's 1,137,960 1,167,146 1,170,230
Undergraduate Total 1,643,967 1,684,255 1,713,527
Preliminary Avg. Annual
1994-95 1995-96 % Change
Non-Resident Alien
Associate 9,651 9,912 5.4
Bachelor's 36,518 37,132 6.8
Undergraduate Total 46,169 47,044 6.5
African American
Associate 44,580 48,590 5.8
Bachelor's 83,645 88,603 5.6
Undergraduate Total 128,225 137,193 5.6
Native American
Associate 5,124 5,144 7.3
Bachelor's 6,389 6,763 7.2
Undergraduate Total 11,603 11,907 7.2
Asian American
Associate 19,701 22,050 9.8
Bachelor's 58,853 61,848 7.4
Undergraduate Total 78,554 83,898 8.0
Hispanic
Associate 33,973 35,326 7.8
Bachelor's 52,759 55,955 8.6
Undergraduate Total 86,732 91,281 8.3
White
Associate 401,949 399,359 0.7
Bachelor's 888,340 878,876 -1.2
Undergraduate Total 1,290,289 1,278,235 -0.6
Unknown
Associate 26,183 11,227 -18.0
Bachelor's 26,588 27,225 2.8
Undergraduate Total 52,771 38,452 -6.0
All
Associate 541,251 531,608 1.2
Bachelor's 1,153,092 1,156,402 0.4
Undergraduate Total 1,694,343 1,688,010 0.7
COPYRIGHT 1998 Cox, Matthews & Associates
© Copyright 2005 by DiverseEducation.com
