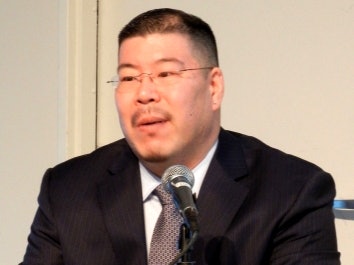
 Dr. Robert Teranishi served as the principal investigator on the CARE report released today.
Upset by the insinuation and portrayal of them as a uniformly privileged population, Asian-American and Pacific Islander students at UCLA tried to point out that many ethnic subgroups were underrepresented on campus and, partly because of this, disadvantaged. They, along with AAPI students at other UC campuses, spent many months calling for administrators to expand and refine their data collection and reporting of their racial demographic.
The following year, the Office of the President announced that it would, on its standardized UC application for undergraduate admissions, expand the number of AAPI ethnicities from eight to 23.
Before long, university officials began receiving data supporting the students’ claims about AAPI heterogeneity and educational disparities. The annual data showed important but worrisome characteristics about some of the subgroups. Student-run organizations at multiple UC campuses have subsequently used the data for funding proposals and to advocate for student needs and to fine-tune their retention efforts.
These are among the findings of a new report showing ways in which disaggregated data of AAPI college students has been collected and reported and how it has been used on campuses.
The report, being released today, was produced by the National Commission on Asian-American and Pacific Islander Research in Education (CARE). With funding from the Educational Testing Service, CARE principal investigator Dr. Robert Teranishi studied several universities with substantial AAPI enrollments—about 36 percent of UCLA’s 27,000-plus undergraduates are AAPI, for instance.
Among other things, the CARE report indicates campuses have seen stark differences in recent years between the proportion of some subgroups in the general population versus the proportion of high school applicants from those subgroups.
In the state of California, for example, Filipinos made up 25 percent of all AAPI residents in 2010, with Southeast Asians comprising 18 percent and Pacific Islanders 2 percent. But among all AAPI applicants to UC-Berkeley that year, Filipinos barely comprised 10 percent, Southeast Asians 13 percent and Pacific Islanders less than 1 percent.
“The data reveal a particularly bleak picture,” states the CARE report, which makes a case for an AAPI data quality movement to better understand the variation of the educational experiences of this racial group.
In response to such data, Southeast Asian students at UC-Berkeley launched a summer educational program on campus that brought together Vietnamese, Lao, Hmong and Cambodian high schoolers and community leaders from throughout the country.
The CARE report also reveals that the average rate of admission for AAPIs in the aggregate doesn’t necessarily represent some of the subgroups.
For instance, Hmong applicants to UCLA were admitted at a rate that was 21 percent lower than that of their Taiwanese counterparts in 2010. Generally, Hmong students were admitted to UCLA at a rate that was 13 percent less than the average for AAPIs in the aggregate. Nine other subgroups, including Filipinos at 10 percent, also saw admissions rates in 2010 that were below the average of the aggregate.
Because of such disparities, the leaders of UCLA’s student-run Samahang Pilipino Education and Retention program obtained information from the campus counseling office showing the frequency of and reasons for Filipino students seeking psychological services. That allowed the retention group to tailor its services to support Filipino students’ mental health and well-being, the CARE report says.
At the University of Guam, disaggregated data illustrated the heterogeneity of Pacific Islanders, who made up about half the enrollment in 2011. The university collected data on four Chamorro subgroups and seven Micronesian subgroups.
According to the CARE report, the data helped support the university’s successful application for a $261,000 federal grant as an Asian American Native American Pacific Islander-Serving Institution. The AANAPISI grant funded enrichment activities such as a mentorship program, tutoring services and targeted academic advising. The mentoring improved student retention by matching 181 students with on-campus administrators or faculty members. And the completion rate of students in developmental math courses increased 14 percent, thanks to the tutoring services.
All this underscores reasons for disaggregating AAPI student data, the CARE report states, noting, “Aggregated data provide a misleading statistical portrait of a heterogeneous AAPI population that consists of subgroups that experience divergent trends in educational outcomes. This is particularly problematic when it conceals significant disparities in opportunities and outcomes for some AAPI subgroups.”
An associate professor of higher education at New York University, Teranishi is among the scheduled speakers at a two-day symposium that begins today at the Washington, D.C., offices of the U.S. Department of Education. The event, titled “iCount: Equity Through Representation,” is co-hosted by CARE and the White House Initiative on AAPIs.
U.S. Education Secretary Arne Duncan is another scheduled speaker at the symposium, which is expected to draw policymakers, data specialists and experts in demography, philanthropy and institutional research to discuss ways of developing data systems and solutions that will ultimately benefit AAPIs in K-12 and higher education.
The impetus for the symposium, Education Department officials say, stems from a department request for information a year ago to colleges and K-12 schools that enroll substantial numbers of AAPI students. The request was for practices and policies surrounding existing systems on disaggregating student data. Based on the feedback, department officials are convening the symposium to focus on best practices from individual campuses that could eventually be adopted at other campuses.


